Learn About Hunger
In 2022, a UVM study showed that 2 in 5 people in Vermont had experienced food insecurity in the past year.
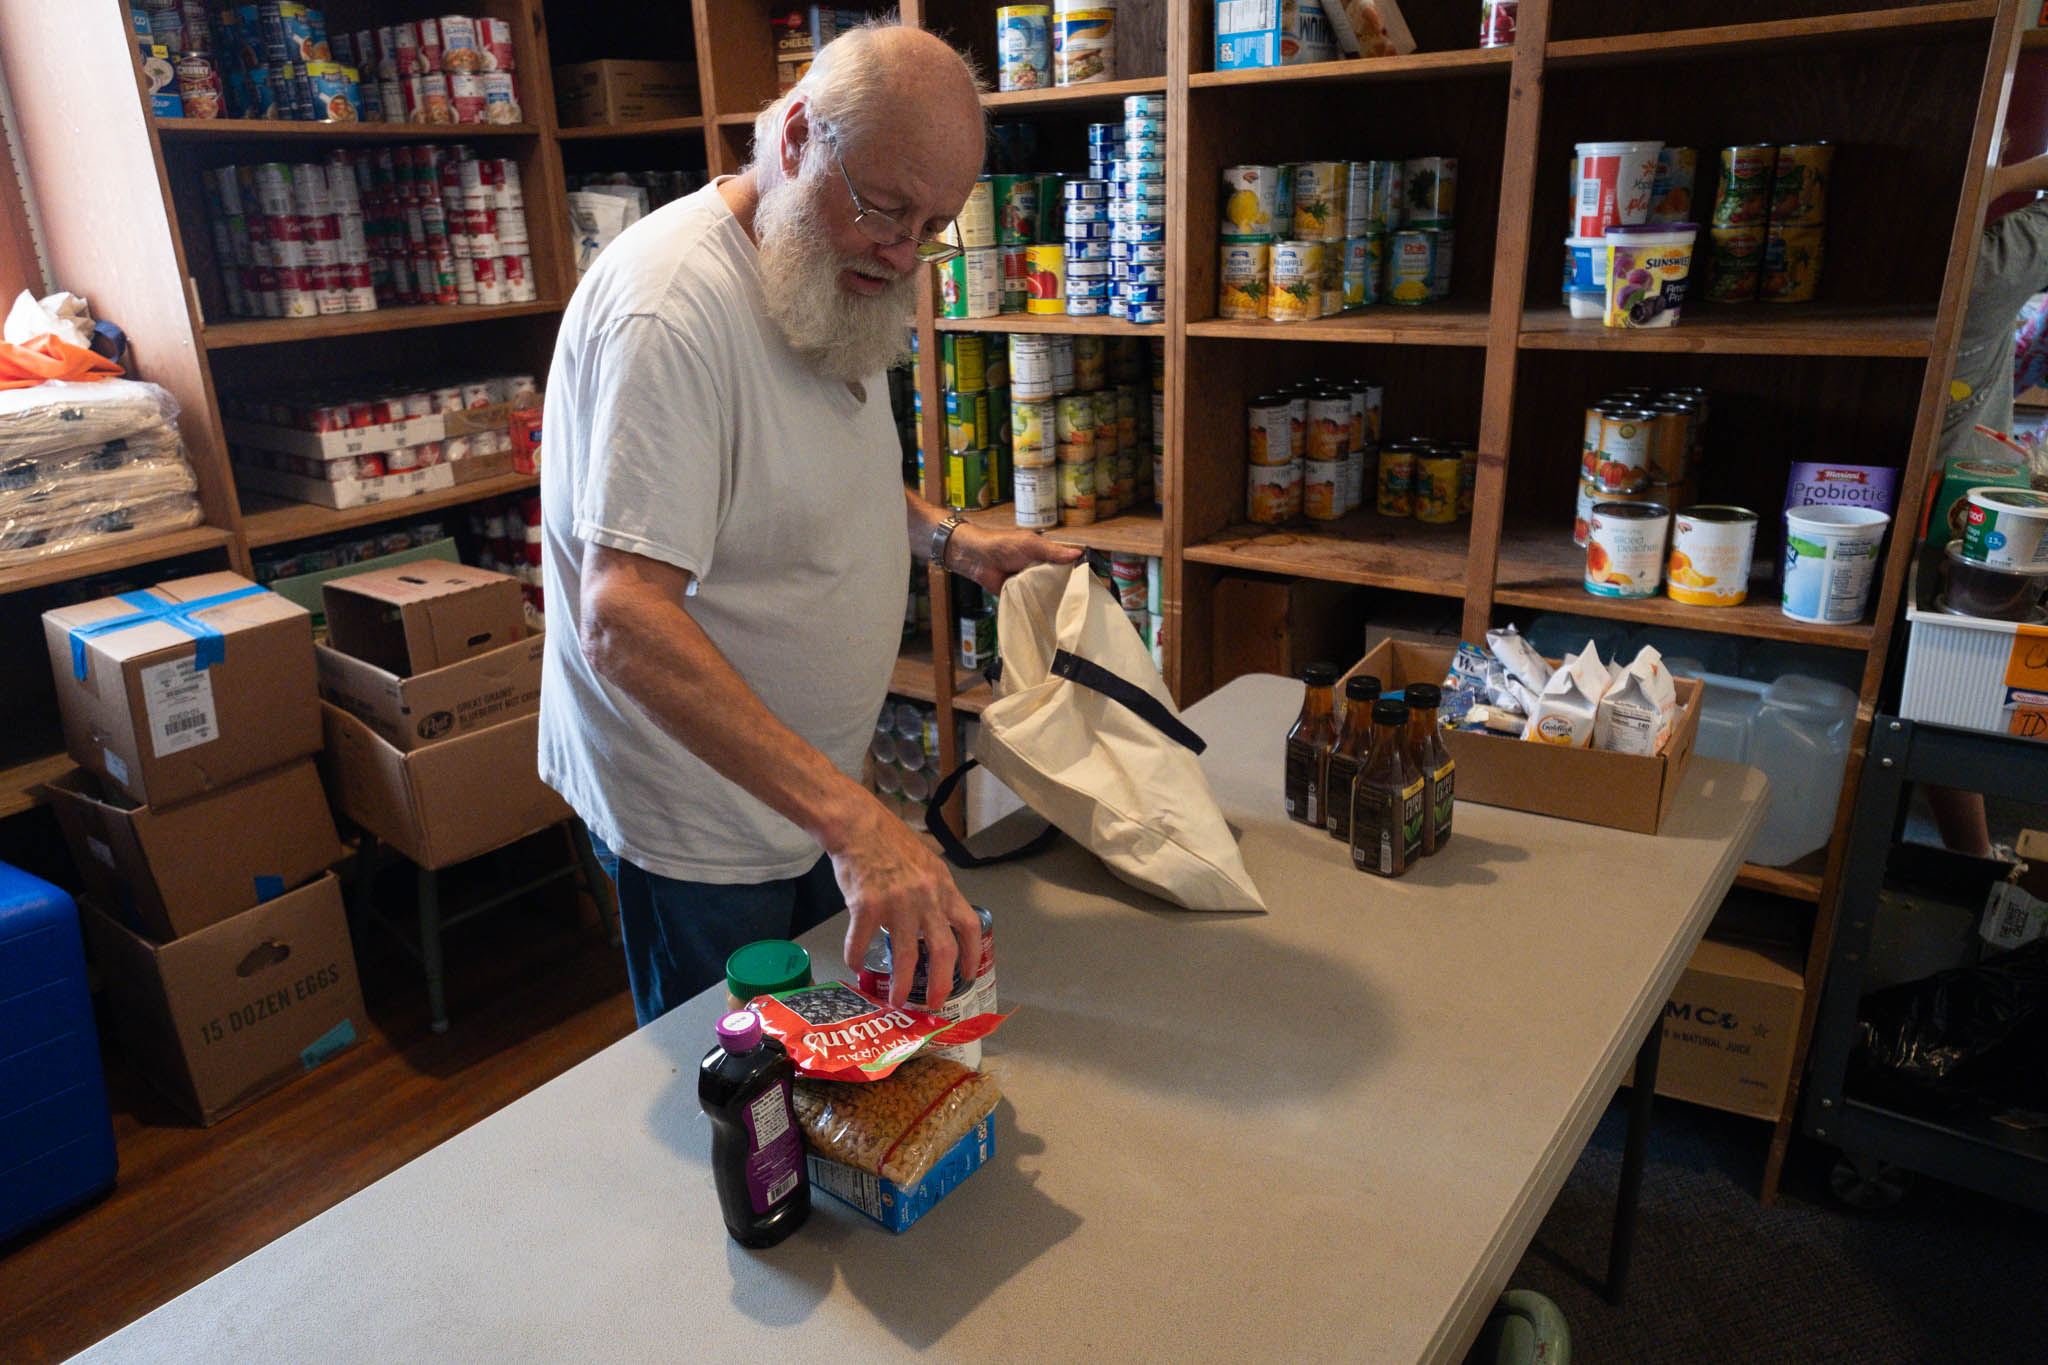
In the last 5 months of 2023, Vermont Foodbank distributed an average of 1.3 million pounds of food per month. The last time monthly numbers were that high was in April of 2021 at the height of the pandemic.

The Data About Hunger in Vermont
During the COVID-19 pandemic, a team of researchers from the University of Vermont participated in the National Food Access and COVID Research Team to collect data about people’s experiences accessing food. This information can be accessed on the NFACT website under Vermont Policy Briefs. This research showed:
2 in 5 People in Vermont Are Food Insecure


Households experiencing job disruptions were 4.3 times as likely to face hunger

Women were 7.3x as likely to face hunger.

BIPOC individuals were 10.4 times as likely to face hunger.

Families with children were 5.2x as likely to face hunger.
Hunger vs Food Insecurity
Food insecurity and hunger are often used interchangeably, and both can be appropriate when speaking about the individual or collective experiences of people who cannot access enough nourishing food for a wide variety of reasons.
Food insecurity is defined by the U.S. Department of Agriculture (USDA) as a lack of consistent access to enough food for an active, healthy lifestyle and hunger as an individual-level physiological condition that may result from food insecurity. This is why that data we share refers to the rate of “food insecurity” and we talk about individual experiences using the word “hunger.” (USDA ERS)
Additional Data About Hunger in The United States
- Feeding America’s Map the Meal Gap (uses 2021 data): Report or Interactive Map
- USDA’s annual Household Food Insecurity in the United States report
- Feeding America’s annual Charitable Food Assistance Participation report
- More sources are listed on Feeding America’s Hunger in America webpage
Why Is There Hunger in Vermont?
Food security is economic security – if people have enough money to cover their basic needs, they can also afford the food they need and want. Without that economic security, they are also unable to afford food. People experience food insecurity in every community in Vermont. Inequality is at the root of food insecurity for many people, but most impacts neighbors of color.
Now, as pandemic-era support programs have ended, our neighbors are still struggling to become food secure. Nearly half of American adults have experienced economic hardship due to the COVID-19 pandemic. Hunger and economic hardship are linked and in Vermont, this has led to 2 in 5 people having experienced hunger in the past year. Economic hardship can include lack of affordable housing; jobs that do not pay a livable wage; increased costs to food, heating fuel, electricity, and other basic needs; rising healthcare costs; lack of transportation and public transportation; stigma associated with using safety net programs; race-based inequities; high cost of post-secondary education; lack of affordable childcare. Many of these underlying “root causes” of hunger remain unaddressed, unresolved, or are worsening.
Food security is a policy choice, but much about our current system is creating and continuing hunger and food insecurity. Many policy choices made by the federal, state, and local governments - some made long ago, others more recent – have led to high levels of hunger and the continuation of hunger in Vermont communities. Stigma and assumptions built into our policy decisions have been used to justify biases and assumptions including believes about who is and is not deserving of resources and support, about work, about the economy, about human nature and human experience, and about who gets to make these fundamental decisions.
But the federal government, State of Vermont, and local governments in cities and towns can make policy choices that will ensure food security for everyone who lives here. The Vermont Food Security Roadmap to 2035 shows us how to ensure everyone in Vermont has the food they need and the Vermont Foodbank’s network of partner organizations is working every day to make sure there is food available to neighbors who need it. Together, we can work to ensure that hidden hunger does not exist in Vermont because everyone has the food they need.